In the last few weeks, SAP 10.0 has been formally published, incorporating a few important changes. Arguably one of the more significant changes is to the way thermal bridging is treated, as specified in Appendix K. This will affect both the carbon calculations, and the Fabric Energy Efficiency (FEEs) criterion. This blog will consider the implications of the changes to Appendix K.
The key changes to Appendix K are
- Adjustments to some of the default psi-values
- A significant increase in the default Y-value
- The removal of the Accredited Construction Details
Also, a minor point is that a new junction, R10 has been added, which is “all other roof or room-in-roof junctions”, to cover the multitude of exciting features invented by architects that cannot be understood by mere mortals. The notional building’s psi-values remain the same.
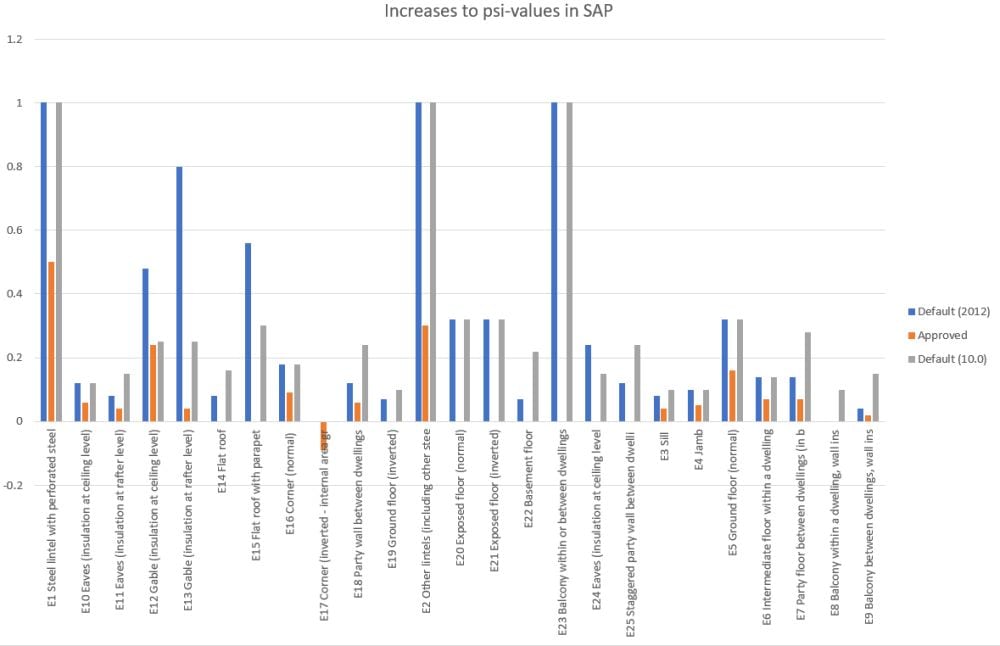
The following chart shows the changes to the psi-values.

Many of the worst-affected psi-values are those involving party walls, so will penalise blocks of flats for example. Roof windows and balconies are also subject to significant uplifts, and most other junctions within roofs, which were only introduced in 2012, and don’t have accredited detail values are also affected.
What does this mean for your project?
We have analysed two case studies based on real projects we have been involved with. Firstly, a typical cavity-masonry house by a mid-size house building company, and secondly a flat within a typical mid-rise building consisting of a concrete frame with SFS infill.
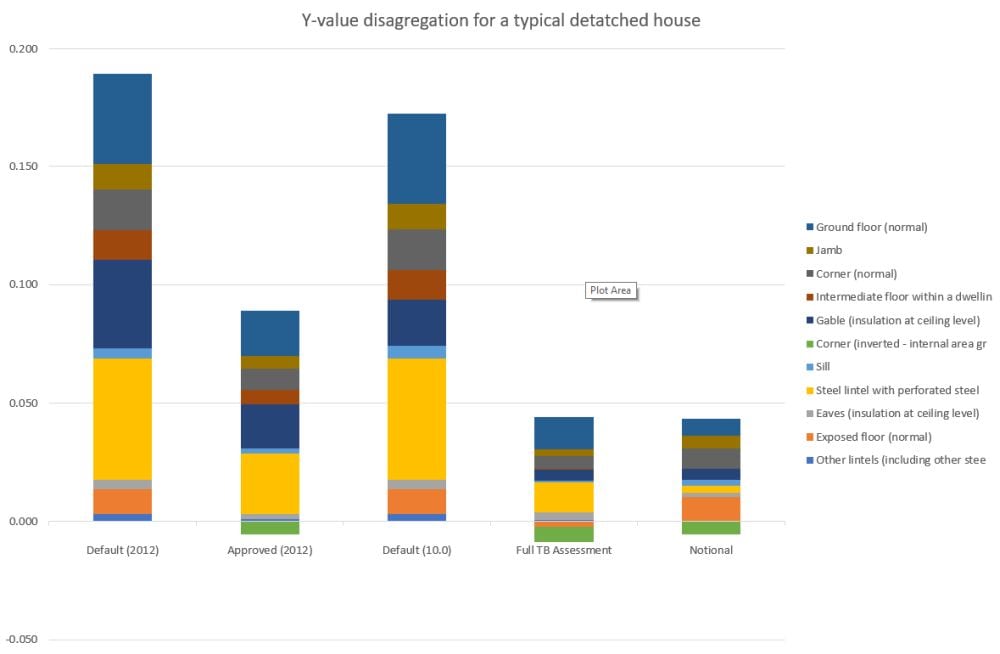
The first graph shows the relative contributions of the different junctions, expressed in terms of the Y-value. The total height of each bar represents the Y-value for each scenario, so it can be seen that under the 2012 default values, the Y-value is 0.19 W/m2.K, which is actually worse (higher) than the default Y-value for 2012, meaning that if the measurements of the junctions were taken, but no improved details were selected, the building would actually be penalised. It can also be seen however, that simply opting for the accredited details gives a significant improvement, reducing the Y-value to about 0.08 W/m2.K. This explains the popularity, and why they have been arguably abused.

Also shown is the disaggregated Y-value for the Notional building, which provides a useful point of reference and something designers may wish to target. It’s interesting that in this case, although the value is made up differently, the overall Y-value (i.e. the contribution of thermal bridging to the heat loss) is almost the same as for our full-assessed design at 0.035 W/m2K.
For this project, the total impact of thermal bridging would actually be less if default values were taken in a SAP 10.0 assessment, because some of the longer junctions are those whose default psi-value is actually reduced in SAP 10.0.
As might be expected, the best results can be had by obtaining psi-values from libraries such as Advanced Details or by a full thermal bridging assessment. In this case, a set of calculations reduced the Y-value to 0.036 W/m2.K. This is without any major design changes or specification of special materials to reduce heat flux through junctions.
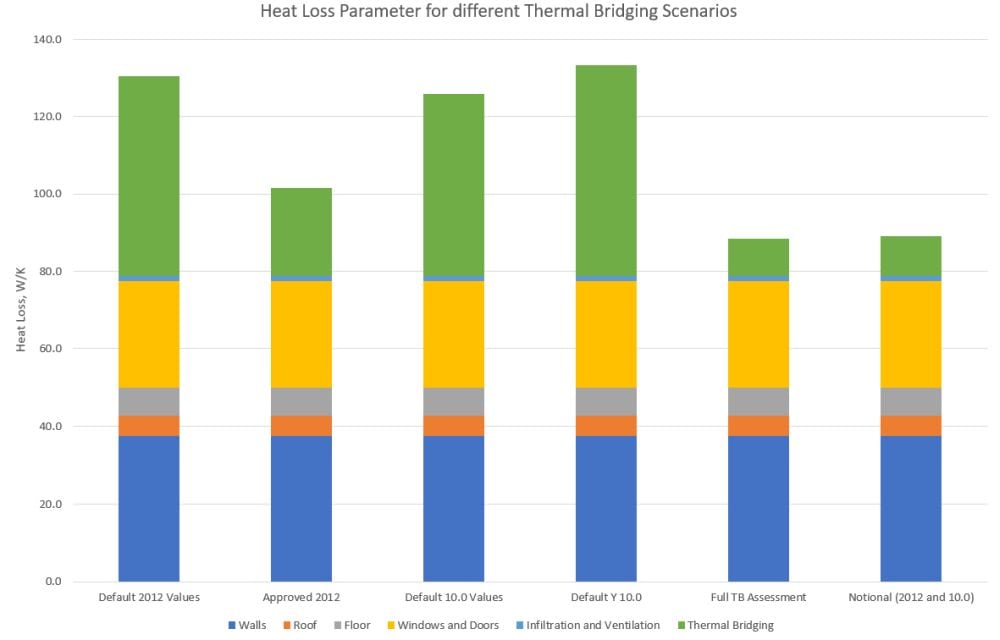
It’s also worth pointing out what the Y-value means, and to set the impact in context. We are not big fans of the Y-value; although it neatly represents the overall thermal bridging impact, it can hide a multitude of sins and can be confusing. The Y-value can be compared directly with the U-values because it takes the same units. If the average U-value for this house was, say 0.18 W/m2.K, it would mean that the effect of thermal bridging increases this to 0.215 W/m2.K. This is not at all insignificant, and this is for a relatively good example. If the new default Y-value was taken, it would almost double the heat losses! The following graph shows the total heat losses from the same building under different thermal bridging situations.
The height of the bars represents the heat loss parameter, which is a metric not usually discussed in relation to SAP, but it is convenient for this illustration. It is roughly analogous to the Fabric Energy Efficiency but does not consider the heat gains.

When SAP 10.0 comes into force (currently unannounced, but we would anticipate it to be late 2019 or 2020), the approved details route will no longer be available. Given that it is already often impossible to pass the FEEs criteria on default values, it will be essential to obtain proper thermal bridge assessments.
Another very important advantage of a full thermal bridging assessment is that the risk of internal surface mould or condensation can be checked. The additional heat flux through the thermal bridge can reduce internal surface temperatures, which increases relative humidity. If the effect is severe enough, conditions might be conducive to mould growth or even the formation of condensation. Approved Documents L and C provide criteria for assessment of this risk, so as well as being a practical concern it is also a compliance issue.
In our next blog we will present another example where assessing thermal bridging creates some counter-intuitive results.


